Given below are two statements:

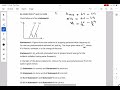
Statement-I: Figure shows the variation of stopping potential with frequency (v) for the two photosensitive materials M1 and M2. The slope gives value of \(\frac{h}{e}\) , where h is Planck's constant, e is the charge of electron.
Statement-II: M2 will emit photoelectrons of greater kinetic energy for the incident radiation having same frequency. In the light of the above statements
Choose the most appropriate answer from the options given below.
- Statement-I is correct and Statement-II is incorrect.
- Statement-I is incorrect but Statement-II is correct.
- Both Statement-I and Statement-II are incorrect.
- Both Statement-I and Statement-II are correct.
The Correct Option is A
Solution and Explanation
The stopping potential (\(V_0\)) is related to frequency (\(\nu\)) by the equation:
\[ eV_0 = h\nu - \phi \implies V_0 = \frac{h}{e}\nu - \frac{\phi}{e} \]
The slope of the graph gives \(\frac{h}{e}\), confirming Statement-I. However, \(M_2\) has a higher work function, meaning that for the same incident frequency, the kinetic energy of emitted photoelectrons will be lower. Therefore, Statement-II is incorrect.
Learn with videos:
Top Questions on Photoelectric Effect
- When a light of a given wavelength falls on a metallic surface the stopping potential for photoelectrons is \(3.2\ \text{V}\). If a second light having wavelength twice of the first light is used, the stopping potential drops to \(0.7\ \text{V}\). The wavelength of the first light is ________ m.
- JEE Main - 2026
- Physics
- Photoelectric Effect
- Light is incident on a metallic plate having work function \(110 \times 10^{-20}\,\text{J}\). If the produced photoelectrons have zero kinetic energy, then the angular frequency of the incident light is _________ rad/s. (\(h = 6.63 \times 10^{-34}\,\text{J·s}\))}
- JEE Main - 2026
- Physics
- Photoelectric Effect
- On a surface, if photon of wavelength $\lambda$ is incident, the stopping potential is $3.2$ V. If the wavelength incident is $2\lambda$, stopping potential is $0.7$ V. Find $\lambda$.
- JEE Main - 2026
- Physics
- Photoelectric Effect
- If the electric field of an EM wave is given by \[ 60\,[\sin(3\times10^{14}t) + \sin(12\times10^{14}t)] \] at \( x = 0 \) and it falls on a photosensitive material having work function \( 2.8\,\text{eV} \), find the maximum kinetic energy (in eV) of the ejected electrons.
- JEE Main - 2026
- Physics
- Photoelectric Effect
- If electric field of EM wave is given by $60[\sin(3 \times 10^{14} t) + \sin(12 \times 10^{14} t)]$ at $x = 0$, falls on a photosensitive material having work function $2.8$ eV. Find the maximum energy (in eV) of ejected electrons.
- JEE Main - 2026
- Physics
- Photoelectric Effect
Questions Asked in JEE Main exam
- In a microscope of tube length $10\,\text{cm}$ two convex lenses are arranged with focal lengths $2\,\text{cm}$ and $5\,\text{cm}$. Total magnification obtained with this system for normal adjustment is $(5)^k$. The value of $k$ is ___.
- JEE Main - 2026
- Optical Instruments
Which one of the following graphs accurately represents the plot of partial pressure of CS₂ vs its mole fraction in a mixture of acetone and CS₂ at constant temperature?


- JEE Main - 2026
- Organic Chemistry
- Let \( ABC \) be an equilateral triangle with orthocenter at the origin and the side \( BC \) lying on the line \( x+2\sqrt{2}\,y=4 \). If the coordinates of the vertex \( A \) are \( (\alpha,\beta) \), then the greatest integer less than or equal to \( |\alpha+\sqrt{2}\beta| \) is:
- JEE Main - 2026
- Coordinate Geometry
- Three charges $+2q$, $+3q$ and $-4q$ are situated at $(0,-3a)$, $(2a,0)$ and $(-2a,0)$ respectively in the $x$-$y$ plane. The resultant dipole moment about origin is ___.
- JEE Main - 2026
- Electromagnetic waves
Let \( \alpha = \dfrac{-1 + i\sqrt{3}}{2} \) and \( \beta = \dfrac{-1 - i\sqrt{3}}{2} \), where \( i = \sqrt{-1} \). If
\[ (7 - 7\alpha + 9\beta)^{20} + (9 + 7\alpha - 7\beta)^{20} + (-7 + 9\alpha + 7\beta)^{20} + (14 + 7\alpha + 7\beta)^{20} = m^{10}, \] then the value of \( m \) is ___________.- JEE Main - 2026
- Complex Numbers and Quadratic Equations