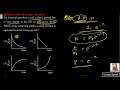
For bacterial growth in a cell culture, growth law is very similar to the law of radioactive decay. Which of the following graphs is most suitable to represent bacterial colony growth? Where \( N \) - Number of Bacteria at any time, \( N_0 \) - Initial number of Bacteria.
Show Hint


The Correct Option is A
Solution and Explanation
To understand which graph is most suitable for representing bacterial colony growth, we need to consider the law that governs bacterial growth:
Simplifying, the number of bacteria \( N \) at any time \( t \) can be expressed as \( N(t) = N_0 \times e^{kt} \), where \( N_0 \) is the initial number of bacteria and \( k \) is the growth rate constant. This equation resembles the exponential growth equation similar to the law of radioactive decay.
An exponential growth model like this is best represented using a graph where:
- The y-axis (vertical axis) displays the number of bacteria, \( N(t) \).
- The x-axis (horizontal axis) represents time, \( t \).
- The curve shows exponential increase as time progresses.
The description of the correct graph among the options provided is:

This graph shows an exponential curve, which is the typical indication of bacterial growth over time under the assumption that resources are unlimited.
Thus, this graph best represents bacterial colony growth following exponential growth dynamics similar to radioactive decay. As time increases, the number of bacteria increases exponentially.
Learn with videos:
Top Questions on Radioactive Decay
- 230Th and 226Ra are intermediate nuclides in the decay series of 238U to 206Pb. The half-lives of 238U, 230Th, and 226Ra are 4.47 billion years, 75,000 years, and 1600 years, respectively. At secular equilibrium, when activities are equal, 10 billion atoms of 238U are present. The number of atoms of 226Ra present at equilibrium is ________
- GATE GG - 2025
- Geology and Geophysics
- Radioactive Decay
- A radioactive material P first decays into Q and then Q decays to non-radioactive material R. Which of the following figure represents time dependent mass of P, Q and R?
- JEE Main - 2025
- Physics
- Radioactive Decay
- A radioactive nucleus \( n_2 \) has 3 times the decay constant as compared to the decay constant of another radioactive nucleus \( n_1 \). If the initial number of both nuclei are the same, what is the ratio of the number of nuclei of \( n_2 \) to the number of nuclei of \( n_1 \), after one half-life of \( n_1 \)?
- JEE Main - 2025
- Physics
- Radioactive Decay
- A radioactive nucleus decays as follows: \[ X \to X_1 \to X_2 \to X_3 \to X_4 \] If the mass number and atomic number of \( X_4 \) are 172 and 69 respectively, the mass number and atomic number of \( X \) are:
- WBJEE - 2025
- Physics
- Radioactive Decay
- Which one of the following is not a type of radioactive decay?
- Bihar Board XII - 2025
- Physics
- Radioactive Decay
Questions Asked in JEE Main exam
- The system of linear equations
$x + y + z = 6$
$2x + 5y + az = 36$
$x + 2y + 3z = b$
has- JEE Main - 2026
- Matrices and Determinants
- The displacement of a particle executing simple harmonic motion with time period \(T\) is expressed as \[ x(t)=A\sin\omega t, \] where \(A\) is the amplitude of oscillation. If the maximum value of the potential energy of the oscillator is found at \[ t=\frac{T}{2\beta}, \] then the value of \(\beta\) is ________.
- JEE Main - 2026
- Waves and Oscillations
- A complex number 'z' satisfy both \(|z-6|=5\) & \(|z+2-6i|=5\) simultaneously. Find the value of \(z^3 + 3z^2 - 15z + 141\).
- JEE Main - 2026
- Algebra
In the given figure, the blocks $A$, $B$ and $C$ weigh $4\,\text{kg}$, $6\,\text{kg}$ and $8\,\text{kg}$ respectively. The coefficient of sliding friction between any two surfaces is $0.5$. The force $\vec{F}$ required to slide the block $C$ with constant speed is ___ N.
(Given: $g = 10\,\text{m s}^{-2}$)
- JEE Main - 2026
- Rotational Mechanics
Two circular discs of radius \(10\) cm each are joined at their centres by a rod, as shown in the figure. The length of the rod is \(30\) cm and its mass is \(600\) g. The mass of each disc is also \(600\) g. If the applied torque between the two discs is \(43\times10^{-7}\) dyne·cm, then the angular acceleration of the system about the given axis \(AB\) is ________ rad s\(^{-2}\).

- JEE Main - 2026
- Rotational motion