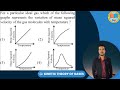
For a particular ideal gas, which of the following graphs represents the variation of mean squared velocity of the gas molecules with temperature?
Show Hint


The Correct Option is C
Solution and Explanation
For an ideal gas, the mean squared velocity \( \langle v^2 \rangle \) is related to the temperature by the equation: \[ \langle v^2 \rangle = \frac{3kT}{m} \] where \( k \) is the Boltzmann constant, \( T \) is the temperature, and \( m \) is the mass of the gas molecules.
Step 1: The equation shows a linear relationship between mean squared velocity and temperature.
Step 2: Therefore, the correct graph is a straight line with a positive slope.
Final Conclusion: The graph representing a linear variation of mean squared velocity with temperature corresponds to Option (3).
Learn with videos:
Top Questions on The Kinetic Theory of Gases
- Consider two boxes containing ideal gases $A$ and $B$ such that their temperatures, pressures and number densities are same. The molecular size of $A$ is half of that of $B$ and mass of molecule $A$ is four times that of $B$. If the collision frequency in gas $B$ is $32\times10^8\ \text{s}^{-1}$, then collision frequency in gas $A$ is ___________\,$\text{s}^{-1}$.
- JEE Main - 2026
- Physics
- The Kinetic Theory of Gases
- The charge stored by the capacitor C in the given circuit in the steady state is _________ $\mu$C.

- JEE Main - 2026
- Physics
- The Kinetic Theory of Gases
- Consider the transition metal ions \( \text{Mn}^{3+}, \text{Cr}^{3+}, \text{Fe}^{3+} \) and \( \text{Co}^{3+} \) and all form low spin octahedral complexes. The correct decreasing order of unpaired electrons in their respective \(d\)-orbitals of the complexes is
- JEE Main - 2026
- Chemistry
- The Kinetic Theory of Gases
- The RMS speeds of \( \mathrm{H_2} \) and \( \mathrm{O_2} \) gases are the same. If the temperature of \( \mathrm{O_2} \) gas is \(23^\circ\mathrm{C}\), find the temperature of \( \mathrm{H_2} \) gas.
- JEE Main - 2026
- Physics
- The Kinetic Theory of Gases
- RMS speed for \( \mathrm{H_2} \) and \( \mathrm{O_2} \) are same. If temperature of \( \mathrm{O_2} \) gas is \( 23^\circ\text{C} \), find the temperature of \( \mathrm{H_2} \) gas.
- JEE Main - 2026
- Physics
- The Kinetic Theory of Gases
Questions Asked in JEE Main exam
Let \( \alpha = \dfrac{-1 + i\sqrt{3}}{2} \) and \( \beta = \dfrac{-1 - i\sqrt{3}}{2} \), where \( i = \sqrt{-1} \). If
\[ (7 - 7\alpha + 9\beta)^{20} + (9 + 7\alpha - 7\beta)^{20} + (-7 + 9\alpha + 7\beta)^{20} + (14 + 7\alpha + 7\beta)^{20} = m^{10}, \] then the value of \( m \) is ___________.- JEE Main - 2026
- Complex Numbers and Quadratic Equations
- The work functions of two metals ($M_A$ and $M_B$) are in the 1 : 2 ratio. When these metals are exposed to photons of energy 6 eV, the kinetic energy of liberated electrons of $M_A$ : $M_B$ is in the ratio of 2.642 : 1. The work functions (in eV) of $M_A$ and $M_B$ are respectively.
- JEE Main - 2026
- Dual nature of matter
- 10 mole of an ideal gas is undergoing the process shown in the figure. The heat involved in the process from \( P_1 \) to \( P_2 \) is \( \alpha \) Joule \((P_1 = 21.7 \text{ Pa}, P_2 = 30 \text{ Pa}, C_v = 21 \text{ J/K mol}, R = 8.3 \text{ J/mol K})\). The value of \( \alpha \) is ________.
- JEE Main - 2026
- Thermodynamics
- The system of linear equations
$x + y + z = 6$
$2x + 5y + az = 36$
$x + 2y + 3z = b$
has- JEE Main - 2026
- Matrices and Determinants
- The displacement of a particle executing simple harmonic motion with time period \(T\) is expressed as \[ x(t)=A\sin\omega t, \] where \(A\) is the amplitude of oscillation. If the maximum value of the potential energy of the oscillator is found at \[ t=\frac{T}{2\beta}, \] then the value of \(\beta\) is ________.
- JEE Main - 2026
- Waves and Oscillations