Question:
A source of sound emits sound waves at frequency \( f_0 \). It is moving towards an observer with fixed speed \( v_s \) (\( v_s < v \), where \( v \) is the speed of sound in air). If the observers were to move towards the source with speed \( v_0 \), one of the following two graphs (A and B) will give the correct variation of the frequency \( f \) heard by the observer as \( v_0 \) changes.

A source of sound emits sound waves at frequency \( f_0 \). It is moving towards an observer with fixed speed \( v_s \) (\( v_s < v \), where \( v \) is the speed of sound in air). If the observers were to move towards the source with speed \( v_0 \), one of the following two graphs (A and B) will give the correct variation of the frequency \( f \) heard by the observer as \( v_0 \) changes.
Show Hint
For moving sources and observers, the Doppler effect formula is critical for understanding frequency shifts. Pay attention to the relative speeds involved.
Updated On: Apr 18, 2025
- Graph A with slope \( \frac{f_0}{v + v_s} \)
- Graph B with slope \( \frac{f_0}{v - v_s} \)
- Graph A with slope \( \frac{f_0}{v - v_s} \)
- Graph B with slope \( \frac{f_0}{v + v_s} \)
Hide Solution
Verified By Collegedunia
The Correct Option is C
Solution and Explanation
The Doppler effect equation for frequency heard by an observer moving towards a source is given by: \[ f = f_0 \frac{v + v_0}{v - v_s} \] This formula indicates that the frequency \( f \) increases as the observer approaches the source. The slope of the graph \( f \) with respect to \( v_0 \) (observer’s speed) is: \[ \text{slope} = \frac{f_0}{v - v_s} \] Thus, graph A is the correct choice.
Was this answer helpful?
0
0
Top Questions on doppler effect
- A passenger is sitting in a fast moving train. The engine of the train blows a whistle of frequency N. If the apparent frequency of sound heard by the passengers is \( N' \), then:
- MHT CET - 2025
- Physics
- doppler effect
- When both the source of sound and observer approach each other with a speed equal to 10% of the speed of sound, then the percentage change in frequency heard by the observer is nearly
- AP EAPCET - 2025
- Physics
- doppler effect
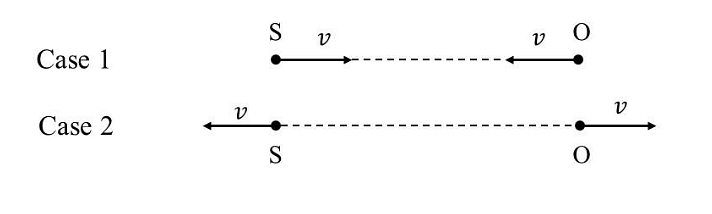
- A source (S) of sound has frequency\( 240 Hz\). When the observer (O) and the source move towards each other at a speed \(v\) with respect to the ground (as shown in Case 1 in the figure), the observer measures the frequency of the sound to be \(288 Hz\). However, when the observer and the source move away from each other at the same speed v with respect to the ground (as shown in Case 2 in the figure), the observer measures the frequency of sound to be \(n\) Hz. The value of \(n\) is _____.
- JEE Advanced - 2024
- Physics
- doppler effect
- A galaxy is moving away from the Earth so that a spectral line at 6000 Å is observed at 6300 Å. Then the speed of the galaxy with respect to the Earth is
- KCET - 2024
- Physics
- doppler effect
- A train is moving with a speed of \(10 m/s\) towards a platform and blows a horn with frequency \(400 Hz\). Find the frequency heard by a passenger standing on the platform. Take speed of sound = \(310 m/s\).
- JEE Main - 2023
- Physics
- doppler effect
View More Questions
Questions Asked in COMEDK UGET exam
- Given that the freezing point of benzene is $ 5.48^\circ C $ and its $ K_f $ value is $ 5.12^\circ C/m $, what would be the freezing point of a solution of 20 g of propane in 400 g of benzene?
- COMEDK UGET - 2024
- Colligative Properties
200 ml of an aqueous solution contains 3.6 g of Glucose and 1.2 g of Urea maintained at a temperature equal to 27$^{\circ}$C. What is the Osmotic pressure of the solution in atmosphere units?
Given Data R = 0.082 L atm K$^{-1}$ mol$^{-1}$
Molecular Formula: Glucose = C$_6$H$_{12}$O$_6$, Urea = NH$_2$CONH$_2$- COMEDK UGET - 2024
- Colligative Properties
- An inorganic compound W undergoes the following reactions: $ W + \text{Na}_2\text{CO}_3 \xrightarrow{\text{O}_2 / \text{heat}} X + H^+ \xrightarrow{} Y(s) $ $ Y(aq) + \text{KCl} (aq) \xrightarrow{} Z(s) $ Z appears in the form of orange crystals and is used as an oxidising agent in acid medium. Identify the compound W.
- COMEDK UGET - 2024
- coordination compounds
- A current of 3.0 A is passed through 750 ml of 0.45 M solution of CuSO₄ for 2 hours with a current efficiency of 90\%. If the volume of the solution is assumed to remain constant, what would be the final molarity of CuSO₄ solution?
- COMEDK UGET - 2024
- Solutions
- For a reaction $ 5X + Y \to 3Z $, the rate of formation of Z is $ 2.4 \times 10^{-5} \, \text{mol L}^{-1} \text{s}^{-1} $. Calculate the average rate of disappearance of X.
- COMEDK UGET - 2024
- Stoichiometry and Stoichiometric Calculations
View More Questions