A region in the form of an equilateral triangle (in x-y plane) of height L has a uniform magnetic field 𝐵⃗ pointing in the +z-direction. A conducting loop PQR, in the form of an equilateral triangle of the same height 𝐿, is placed in the x-y plane with its vertex P at x = 0 in the orientation shown in the figure. At 𝑡 = 0, the loop starts entering the region of the magnetic field with a uniform velocity 𝑣 along the +x-direction. The plane of the loop and its orientation remain unchanged throughout its motion.
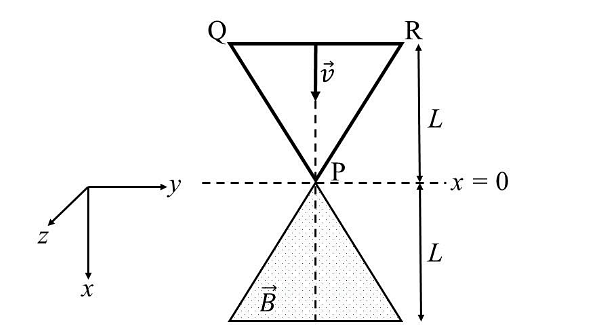
Which of the following graph best depicts the variation of the induced emf (E) in the loop as a function of the distance (𝑥) starting from 𝑥 = 0?
Which of the following graph best depicts the variation of the induced emf (E) in the loop as a function of the distance (𝑥) starting from 𝑥 = 0?


The Correct Option is A
Approach Solution - 1
To solve the problem, we need to analyze the variation of the induced emf in a conducting triangular loop moving through a region of uniform magnetic field.
1. Understanding the Setup:
- The loop PQR is an equilateral triangle of height \( L \) moving along the \( +x \)-direction.
- The magnetic field \( \vec{B} \) is uniform and points in the \( +z \)-direction.
- At \( x=0 \), vertex P enters the magnetic field region.
- The induced emf \( E \) is related to the rate of change of magnetic flux through the loop.
2. Variation of Flux and emf:
- Initially, no part of the loop is inside the magnetic field, so \( E = 0 \).
- As the loop enters the field (from \( x=0 \) to \( x=L \)), the area inside the field increases linearly, so flux increases linearly.
- The emf \( E = -d\Phi/dt \) is proportional to the rate of change of flux.
- When half the loop enters (\( x=L/2 \)), the rate of change of area changes slope.
- Between \( x=L \) and \( x=2L \), the loop is leaving the field and the flux decreases.
- Beyond \( x=2L \), the loop is completely outside, so \( E = 0 \).
3. Shape of emf vs. distance graph:
- The emf starts at zero at \( x=0 \), decreases (negative slope) until \( x=L/2 \), then increases until \( x=L \).
- After \( x=L \), emf is zero until \( x=3L/2 \), then increases positively until \( x=2L \), and finally returns to zero.
- This corresponds to graph (A) with negative and positive triangular peaks.
Final Answer:
Option (A)
Approach Solution -2
To solve the problem, analyze how the induced emf in the loop changes as the loop moves through the magnetic field region.
1. Setup:
- The loop PQR is an equilateral triangle of height \(L\), moving along the +x direction.
- Magnetic field \(\vec{B}\) is uniform and directed along +z.
- Induced emf \(E\) is related to the rate of change of magnetic flux through the loop.
- At \(x=0\), vertex P enters the magnetic field region.
2. Flux and emf behavior:
- For \(0 \leq x < L\): increasing part of the loop enters the field.
- The flux increases non-linearly, first faster then slower due to triangular shape.
- This results in a changing induced emf with negative and positive slopes at different points.
- For \(L \leq x \leq 2L\): the loop leaves the magnetic field region.
- The flux decreases similarly, giving a characteristic emf pattern.
3. Graph Interpretation:
- The induced emf first decreases (negative peak) as the loop enters.
- Then it increases to zero at \(x=L\).
- After that, it stays zero for some region.
- Finally, it increases positively as the loop leaves the field and goes back to zero at \(x=2L\).
- This matches graph (A).
Final Answer:
Option (A)
Top Questions on torque
- The coordinates of a particle with respect to origin in a given reference frame is \( (1, 1, 1) \) meters. If a force of \( \mathbf{F} = \hat{i} - \hat{j} + \hat{k} \) acts on the particle, then the magnitude of torque (with respect to origin) in the z-direction is:
A square Lamina OABC of length 10 cm is pivoted at \( O \). Forces act at Lamina as shown in figure. If Lamina remains stationary, then the magnitude of \( F \) is:

- A cube having a side of 10 cm with unknown mass and 200 gm mass were hung at two ends of an uniform rigid rod of 27 cm long. The rod along with masses was placed on a wedge keeping the distance between wedge point and 200 gm weight as 25 cm. Initially the masses were not at balance. A beaker is placed beneath the unknown mass and water is added slowly to it. At given point the masses were in balance and half volume of the unknown mass was inside the water. (Take the density of the unknown mass is more than that of the water, the mass did not absorb water and water density is 1 gm/cm$^3$.) The unknown mass is ______ kg.
- The coordinates of a particle with respect to origin in a given reference frame is \( (1, 1, 1) \) meters. If a force of \( \mathbf{F} = \hat{i} - \hat{j} + \hat{k} \) acts on the particle, then the magnitude of torque (with respect to origin) in the z-direction is:
- A uniform rod of mass 250 g having length 100 cm is balanced on a sharp edge at the 40 cm mark. A mass of 400 g is suspended at the 10 cm mark. To maintain the balance of the rod, the mass to be suspended at the 90 cm mark is:
Questions Asked in JEE Advanced exam
- Let $ x_0 $ be the real number such that $ e^{x_0} + x_0 = 0 $. For a given real number $ \alpha $, define $$ g(x) = \frac{3xe^x + 3x - \alpha e^x - \alpha x}{3(e^x + 1)} $$ for all real numbers $ x $. Then which one of the following statements is TRUE?
- JEE Advanced - 2025
- Fundamental Theorem of Calculus
- A linear octasaccharide (molar mass = 1024 g mol$^{-1}$) on complete hydrolysis produces three monosaccharides: ribose, 2-deoxyribose and glucose. The amount of 2-deoxyribose formed is 58.26 % (w/w) of the total amount of the monosaccharides produced in the hydrolyzed products. The number of ribose unit(s) present in one molecule of octasaccharide is _____.
Use: Molar mass (in g mol$^{-1}$): ribose = 150, 2-deoxyribose = 134, glucose = 180; Atomic mass (in amu): H = 1, O = 16- JEE Advanced - 2025
- Biomolecules
Let $ P(x_1, y_1) $ and $ Q(x_2, y_2) $ be two distinct points on the ellipse $$ \frac{x^2}{9} + \frac{y^2}{4} = 1 $$ such that $ y_1 > 0 $, and $ y_2 > 0 $. Let $ C $ denote the circle $ x^2 + y^2 = 9 $, and $ M $ be the point $ (3, 0) $. Suppose the line $ x = x_1 $ intersects $ C $ at $ R $, and the line $ x = x_2 $ intersects $ C $ at $ S $, such that the $ y $-coordinates of $ R $ and $ S $ are positive. Let $ \angle ROM = \frac{\pi}{6} $ and $ \angle SOM = \frac{\pi}{3} $, where $ O $ denotes the origin $ (0, 0) $. Let $ |XY| $ denote the length of the line segment $ XY $. Then which of the following statements is (are) TRUE?
- JEE Advanced - 2025
- Conic sections
- Adsorption of phenol from its aqueous solution on to fly ash obeys Freundlich isotherm. At a given temperature, from 10 mg g$^{-1}$ and 16 mg g$^{-1}$ aqueous phenol solutions, the concentrations of adsorbed phenol are measured to be 4 mg g$^{-1}$ and 10 mg g$^{-1}$, respectively. At this temperature, the concentration (in mg g$^{-1}$) of adsorbed phenol from 20 mg g$^{-1}$ aqueous solution of phenol will be ____. Use: $\log_{10} 2 = 0.3$
- JEE Advanced - 2025
- Adsorption
- At 300 K, an ideal dilute solution of a macromolecule exerts osmotic pressure that is expressed in terms of the height (h) of the solution (density = 1.00 g cm$^{-3}$) where h is equal to 2.00 cm. If the concentration of the dilute solution of the macromolecule is 2.00 g dm$^{-3}$, the molar mass of the macromolecule is calculated to be $X \times 10^{4}$ g mol$^{-1}$. The value of $X$ is ____. Use: Universal gas constant (R) = 8.3 J K$^{-1}$ mol$^{-1}$ and acceleration due to gravity (g) = 10 m s$^{-2}\}$
- JEE Advanced - 2025
- Colligative Properties