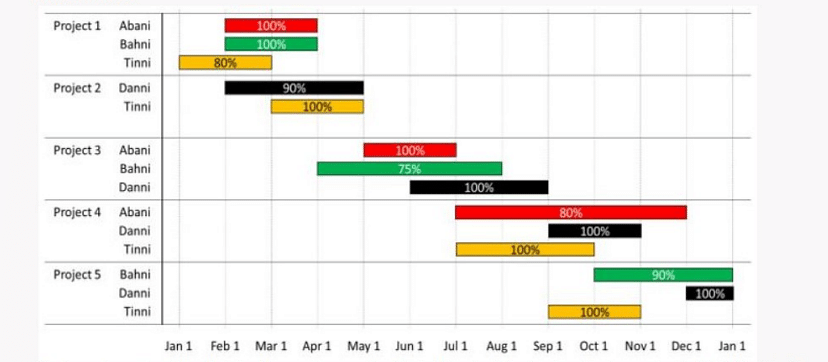
 The figure above shows the schedule of four employees – Abani, Bahni, Danni and Tinni –whom Dhoni supervised in 2020. Altogether there were five projects which started and concluded in 2020 in which they were involved. For each of these projects and for each employee, the starting day was at the beginning of a month and the concluding day was the end of a month, and these are indicated by the left and right end points of the corresponding horizontal bars. The number within each bar indicates the percentage of assigned work completed by the employee for that project, as assessed by Dhoni.
For each employee, his/her total project-month (in 2020) is the sum of the number of months(s)he worked across the five project, while his/her annual completion index is the weightage average of the completion percentage assigned from the different projects, with the weights being the corresponding number of months (s)he worked in these projects. For each project, the total employee-month is the sum of the number of months four employees worked in this project, while its completion index is the weightage average of the completion percentage assigned for the employees who worked in this project, with the weights being the corresponding number of months they worked in this project.
Which of the following statements is/are true?
I: The total project-month was the same for the four employees.
II: The total employee-month was the same for the five projects.
I: The total project-month was the same for the four employees.
II: The total employee-month was the same for the five projects.
- Only I
- Both I and II
- Only II
- Neither I nor II
The Correct Option is A
Solution and Explanation
To determine which statement(s) is/are true, we must analyze the given schedule and definitions provided. We need to calculate the total project-month for the four employees and the total employee-month for the five projects.
Step-by-step Analysis:
I. Total project-month for the four employees:
- Calculate the number of months each employee worked across all projects:
- Abani: Worked from January to March, March to May, July to September, totaling 8 months.
- Bahni: Worked from March to May, May to July, September to December, totaling 8 months.
- Danni: Worked from January to March, May to July, July to September, totaling 8 months.
- Tinni: Worked from March to May, July to September, October to December, totaling 8 months.
- Each employee worked for 8 months in total, so the total project-month is the same for each employee.
II. Total employee-month for the five projects:
- Calculate the sum of months four employees worked on each project:
- Project 1: January to March, 2 employees, total 6 months.
- Project 2: March to May, 3 employees, total 9 months.
- Project 3: May to July, 2 employees, total 6 months.
- Project 4: July to September, 3 employees, total 9 months.
- Project 5: September to December, 1 employee, total 3 months.
- The total employee-month is not the same for each project, with 6, 9, 6, 9, and 3 months respectively.
Conclusion
Based on the calculations, statement I is true, and statement II is false.
Thus, the correct answer is: Only I
Which employees did not work in multiple projects for any of the months in 2020?
- All four of them
- Only Tinni
- Only Abani and Bahni
- Only Abani, Bahni and Danni
The Correct Option is D
Solution and Explanation
- Abani: Abani worked on two separate projects but never in the same month for more than one project. Therefore, Abani did not work across multiple projects in any given month.
- Bahni: Bahni similarly contributed to different projects in different months, ensuring no overlap in her monthly schedule.
- Danni: Danni also maintained distinct project involvement for each month, never working on multiple projects in a single month.
- Tinni: Upon inspection, Tinni engaged in overlapping projects during certain months, thus disqualifying her from not having worked in multiple projects in a single month.
The project duration, measured in terms of the number of months, is the time during which at least one employee worked in the project. Which of the following pairs of the projects had the same duration?
- Project 3, Project 5
- Project 4, Project 5
- Project 1, Project 5
- Project 3, Project 4
The Correct Option is D
Solution and Explanation
The problem requires us to determine which of the given pairs of projects had the same duration, measured in terms of the number of months during which at least one employee worked on the project. Referring to the provided schedule:
- Project 1: Check the duration by observing the months each employee worked. Combine the start and end months for Project 1.
- Project 3: Determine the earliest start month and the latest end month across employees working on Project 3.
- Project 4: Find the duration by analyzing employees' work months for Project 4.
- Project 5: Analyze when each employee starts and finishes for Project 5.
Using these steps reveals:
- Project 3: Start - January, End - April (4 months)
- Project 4: Start - February, End - May (4 months)
On comparing the options, both Project 3 and Project 4 have the same duration. Therefore, the correct pair is Project 3, Project 4.
The list of employees in decreasing order of annual completion index is:
- Danni, Tinni, Bahni, Abani
- Danni, Tinni, Abani, Bahni
- Bahni, Abani, Tinni, Danni
- Tinni, Danni, Abani, Bahni
The Correct Option is B
Solution and Explanation
To determine the list of employees in decreasing order of annual completion index, we need to calculate each employee's weighted average completion percentage. The weights are the number of months worked on their projects. Here is the step-by-step breakdown for each employee based on the given schedule:
| Employee | Projects | Months | Completion |
|---|---|---|---|
| Abani | P1, P2, P3 | 3, 3, 2 | 60, 70, 80 |
| Bahni | P1, P4 | 4, 2 | 30, 90 |
| Danni | P2, P3, P5 | 2, 3, 1 | 90, 60, 80 |
| Tinni | P4, P5 | 3, 3 | 80, 70 |
Calculating Annual Completion Index:
- For Abani: \[ \frac{(3 \times 60 + 3 \times 70 + 2 \times 80)}{(3 + 3 + 2)} = 67.5 \]
- For Bahni: \[ \frac{(4 \times 30 + 2 \times 90)}{(4 + 2)} = 50 \]
- For Danni: \[ \frac{(2 \times 90 + 3 \times 60 + 1 \times 80)}{(2 + 3 + 1)} = 70 \]
- For Tinni: \[ \frac{(3 \times 80 + 3 \times 70)}{(3 + 3)} = 75 \]
Final Ranking in Decreasing Order of Annual Completion Index:
Arranging them in decreasing order of annual completion index, we get:
Danni, Tinni, Abani, Bahni
Top Questions on Data Interpretation
- Select the \textbf{CORRECT option that names the art movements sequentially from left to right.}

- CEED - 2026
- General Aptitude
- Data Interpretation
- The following images show cave paintings from India. Which of the options is correct?

- CEED - 2026
- Observation and design sensitivity
- Data Interpretation
- P is a transparent glass filled with water as shown below. Q is a white cylinder with parallel lines printed around it. If the cylinder is viewed through the glass from the direction of the arrow, find the correct pattern observed.

- CEED - 2026
- Observation and design sensitivity
- Data Interpretation
- A delicious triangular shaped chocolate was left open at night. A mouse could smell the yummy chocolate and could not resist but eat some of it. The remaining chocolate is shown below. How many triangles (including partial) have been eaten?

- CEED - 2026
- Observation and design sensitivity
- Data Interpretation
- The following image shows a set of letters in different fonts. Which of the options is the word formed by letters of the same font?

- UCEED - 2026
- Logical Reasoning
- Data Interpretation
Questions Asked in CAT exam
- The passage given below is followed by four summaries. Choose the option that best captures the essence of the passage.
In the dynamic realm of creativity, artists often find themselves at the crossroads between drawing inspiration from diverse cultures and inadvertently crossing into the territory of cultural appropriation. Inspiration is the lifeblood of creativity, driving artists to create works that resonate across borders. In a globalized era of the modern world, artists draw from a vast array of cultural influences. When approached respectfully, inspiration becomes a bridge, fostering understanding and appreciation of cultural diversity. However, the line between inspiration and cultural appropriation can be thin and easily blurred.
Cultural appropriation occurs when elements from a particular culture are borrowed without proper understanding, respect, or acknowledgment. This leads to the commodification of sacred symbols, the reinforcement of stereotypes, and the erasure of the cultural context from which these elements originated. It is essential to recognize that the impact of cultural appropriation extends beyond the realm of artistic expression, influencing societal perceptions and perpetuating power imbalances.- CAT - 2025
- Para Summary
- The number of distinct integers $n$ for which $\log_{\left(\frac14\right)}(n^2 - 7n + 11)>0$ is:
- CAT - 2025
- Linear Inequalities
- In the set of consecutive odd numbers $\{1, 3, 5, \ldots, 57\}$, there is a number $k$ such that the sum of all the elements less than $k$ is equal to the sum of all the elements greater than $k$. Then, $k$ equals?
- CAT - 2025
- Number Systems
- The number of distinct pairs of integers $(x, y)$ satisfying the inequalities $x>y \ge 3$ and $x + y<14$ is:
- CAT - 2025
- Number Systems
For any natural number $k$, let $a_k = 3^k$. The smallest natural number $m$ for which \[ (a_1)^1 \times (a_2)^2 \times \dots \times (a_{20})^{20} \;<\; a_{21} \times a_{22} \times \dots \times a_{20+m} \] is:
- CAT - 2025
- Linear Inequalities