Question:
The restriction map of a circular plasmid is shown below, along with the indicated distances between the restriction sites.
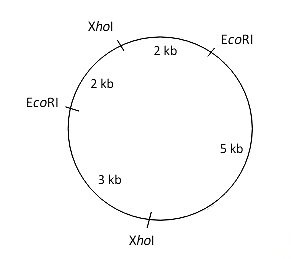
The plasmid was completely digested with EcoRI, and XhoI. The products were analysed by agarose gel electrophoresis followed by ethidium bromide staining. The number of bands that will be visible in the gel when exposed to UV light is __________.
The restriction map of a circular plasmid is shown below, along with the indicated distances between the restriction sites.
The plasmid was completely digested with EcoRI, and XhoI. The products were analysed by agarose gel electrophoresis followed by ethidium bromide staining. The number of bands that will be visible in the gel when exposed to UV light is __________.
The plasmid was completely digested with EcoRI, and XhoI. The products were analysed by agarose gel electrophoresis followed by ethidium bromide staining. The number of bands that will be visible in the gel when exposed to UV light is __________.
Updated On: Feb 2, 2025
Hide Solution
Verified By Collegedunia
Correct Answer: 3
Solution and Explanation
EcoRI cuts the plasmid into two fragments (2 kb and 3 kb), and XhoI cuts it into 2 fragments (2 kb and 5 kb). The restriction map shows two EcoRI and two XhoI sites, leading to a total of three distinct bands when the plasmid is completely digested
Was this answer helpful?
3
11
Top Questions on Biotechnology
- Describe the structure and working of a sparged stirred-tank bioreactor.
- CBSE CLASS XII - 2025
- Biology
- Biotechnology
- The introduction of a gene sequence into a cell with the aim of modifying the cell's behaviour in a clinically relevant fashion is termed as?
- "Blinding" is most commonly done in:
- CUET (PG) - 2025
- Public Health
- Biotechnology
- What is the primary purpose of using T4 DNA ligase in recombinant DNA technology?
- CUET (PG) - 2025
- Public Health
- Biotechnology
- What is the role of reverse transcriptase in recombinant DNA technology?
- CUET (PG) - 2025
- Public Health
- Biotechnology
View More Questions
Questions Asked in IIT JAM BT exam
Identify the taxa that constitute a paraphyletic group in the given phylogenetic tree.

- IIT JAM BT - 2025
- Genetics
- Match the animals in Group I with the major form of excreted nitrogen metabolite in Group II. \[ \begin{array}{c|c} \text{Group I} & \text{Group II} \\ \hline P:\; \text{Bony fishes} & 3:\; \text{Ammonia} \\ Q:\; \text{Lions} & 1:\; \text{Urea} \\ R:\; \text{Birds} & 2:\; \text{Uric acid} \\ \end{array} \]
- IIT JAM BT - 2025
- Metabolism
- If \[ P = \begin{pmatrix} \cos\alpha & \sin\alpha \\ -\sin\alpha & \cos\alpha \end{pmatrix} \] and \(P + P^T = I\), the value of \(\alpha \; (0 \leq \alpha \leq \pi/2)\) is
- IIT JAM BT - 2025
- Mathematics
- A rare genetic disorder resulting from homozygosity for a recessive allele (\( r \)) occurs in 2 out of every 10,000 individuals in a population. Assuming that (i) the disorder is not lethal, (ii) the disorder does not impact reproductive success, (iii) no new mutations are introduced in the population, and (iv) the population follows Hardy-Weinberg equilibrium, the percentage (%) of the carriers in the population that pass the \( r \) allele to offspring is .......... (rounded off to 1 decimal)
- IIT JAM BT - 2025
- Genetics
- A cDNA was synthesized from the mRNA of a eukaryotic gene. After cloning and sequence analysis, the double-stranded cDNA of 614 bp revealed 125 bp 5'-UTR and 120 bp 3'-UTR. The number of amino acids present in the polypeptide encoded by this gene is ............... (answer in integer)
- IIT JAM BT - 2025
- Genetics
View More Questions