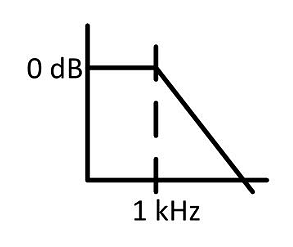
Question:
In a bode magnitude plot, which one of the following slopes would be exhibited at high frequencies by a 4th order all-pole system?
In a bode magnitude plot, which one of the following slopes would be exhibited at high frequencies by a 4th order all-pole system?
Show Hint
Bode Plot Slopes. Each pole contributes -20 dB/decade (-6 dB/octave) to the magnitude slope at high frequencies. Each zero contributes +20 dB/decade (+6 dB/octave). The net high-frequency slope depends on the difference between the number of poles and finite zeros (relative degree). For an n-th order all-pole system, the high-frequency slope is -20n dB/decade.
Updated On: May 7, 2025
- -80 dB/decade
- -40 dB/decade
- 40 dB/decade
- 80 dB/decade
Hide Solution
Verified By Collegedunia
The Correct Option is A
Solution and Explanation
A Bode magnitude plot shows the logarithm of the magnitude of a system's frequency response (\(|H(j\omega)|\)) versus the logarithm of frequency (\(\omega\))
The slope of the plot indicates how the magnitude changes with frequency
An all-pole system has a transfer function with poles but no finite zeros
The high-frequency behavior is dominated by the poles
Each pole contributes a slope of -20 dB/decade to the magnitude plot beyond its corner frequency
A 4th order all-pole system has 4 poles
At high frequencies (well beyond all pole corner frequencies), the contributions from all 4 poles add up
Total high-frequency slope = (Number of poles) \(\times\) (-20 dB/decade/pole) Total slope = 4 \(\times\) (-20 dB/decade) = -80 dB/decade
Was this answer helpful?
0
0
Top Questions on Bode Plot
- In a bode magnitude plot, which one of the following slopes would be exhibited at high frequencies by a 4th order all-pole system?
- The Bode plot of a 2nd order low pass filter is shown in the figure below. What is the frequency at which the attenuation is 80 dB ?

- The magnitude and phase plots of an LTI system are shown in the figure. The transfer function of the system is: \begin{center} \includegraphics[width=0.45\textwidth]{15.jpeg} \end{center}
- The Bode magnitude plot of a first order stable system is constant with frequency. The asymptotic value of the high frequency phase, for the system, is -180°. This system has

- In a unity-gain feedback control system, the plant \[ P(s) = \frac{0.001}{s(2s + 1)(0.01s + 1)} \] is controlled by a lag compensator \[ C(s) = \frac{s + 10}{s + 0.1} \] The slope (in dB/decade) of the asymptotic Bode magnitude plot of the loop gain at \( \omega = 3 \, \text{rad/s} \) is _________ (in integer).
View More Questions
Questions Asked in AP PGECET exam
- The absolute humidity of air at 101.325 kPa is measured to be 0.02 kg of water per kg of dry air. Then the partial pressure of water vapour in the air is:
- AP PGECET - 2025
- Thermodynamics
- If the vapour pressure at two temperatures of a solid phase in equilibrium with its liquid phase is known, then the latent heat of fusion can be calculated by the:
- AP PGECET - 2025
- Thermodynamics
- 1 mole of Argon gas is heated at constant pressure from 200 K to 600 K.
If \( C_p = 4\ \text{cal} \cdot \text{deg}^{-1} \cdot \text{mol}^{-1} \), then the change in entropy will be:
(Given \( \ln 3 = 1.09 \))
- AP PGECET - 2025
- Thermodynamics
- The minimum amount of work required to operate a refrigerator which removes 1000 Cal heat at $0^\circ$C and rejects at $50^\circ$C will be:
- AP PGECET - 2025
- Thermodynamics
- The entropy of single crystalline Silicon at absolute zero will be:
- AP PGECET - 2025
- Thermodynamics
View More Questions