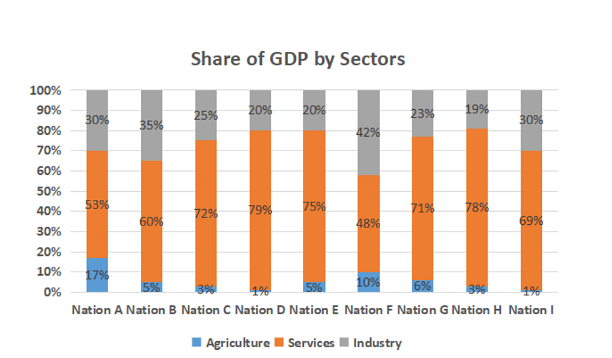
The following graph depicts sector-wise percentage contributions to the gross domestic product (GDP) of nine nations, labelled “Nation A”, “Nation B” and so on. It is known that these nations are Brazil, China, France, Germany, India, Japan, Russia, the UK and the USA, but not necessarily in the same order.
The following, however, are known:
i) The GDPs of the nine nations (in US $ trillion) are:
| Nation | Brazil | China | France | Germany | Japan | India | Russia | UK | USA |
| GDP | 2 | 10 | 3 | 4 | 5 | 2 | 2 | 3 | 17 |
iii) In terms of percentage contribution to the respective nations’ GDPs by their service sectors, the UK and France are respectively the first and the second
iv) Nation A, Nation B and Nation G have the same GDP
v) The GDP of India’s industry sector is lower than the GDP of Russia’s industry sector. However, it is larger than that of Brazil's industry sector
Based on the given information, how many nations can be uniquely identified?
- 6
- 9
- 3
- 2
- 7
The Correct Option is A
Solution and Explanation
1. From the graph and options provided, we identify sectors contributing to GDP.
2. Given data:
- China: Highest agriculture GDP, US $1 trillion.
- USA: Follows China in agriculture GDP.
- UK: Highest service sector percentage contribution.
- France: Second in service sector percentage contribution.
- Nation A, B, G: Same GDP.
- India’s industry GDP is lower than Russia's, higher than Brazil's.
| Nation | Brazil | China | France | Germany | Japan | India | Russia | UK | USA |
| GDP | 2 | 10 | 3 | 4 | 5 | 2 | 2 | 3 | 17 |
- Nations (2) – Brazil, India, Russia.
- Nations (3) – France, UK.
- Nations (10) – China.
- Nations (17) – USA.
- China: Largest agriculture sector GDP.
- USA: Second in agriculture sector GDP.
- UK: Highest service sector percentage.
- France: Second in service sector percentage.
- Russia: Higher than India's industry GDP.
- Identified nations: China, USA, UK, France, India, Russia.
This leads to six nations being uniquely identifiable: China, USA, UK, France, India, Russia.
Based on the given information, which of the following CANNOT be ruled out?
- US is Nation I
- Russia is Nation G
- China is Nation C
- Japan is Nation E
- India is Nation B
The Correct Option is D
Solution and Explanation
- Review the GDPs: We know the GDPs of Brazil, China, France, Germany, Japan, India, Russia, UK, and USA, as given and need to match them with Nation A to I.
- China has the highest agriculture GDP, indicating Nation that has the highest agriculture sector percentage times its total GDP should match China.
- The USA follows China in agriculture GDP, so it should have the second highest value when calculating sector contribution.
- The UK and France lead in service sector contributions by percentage, so Nations with highest service sector percentages should match them.
- Nations A, B and G having the same GDP implies they are either Brazil, Russia, or India, each with a GDP of 2 trillion US$.
- India's industry sector GDP lower than Russia's implies the percentage of the industry sector times GDP for India is less than for Russia, and more than Brazil.
- From given options:
- US is Nation I: The USA has the largest GDP (17 trillion). If Nation I has the highest GDP, the percentage distributions must match the USA’s known sector distribution information, i.e., second in agriculture.
- Russia is Nation G: Russia has a GDP of 2 trillion USD, so Nation G must meet specific criteria with industry dominance compared to India and Brazil.
- China is Nation C: Nation with highest GDP in agriculture should match China's requirements.
- Japan is Nation E: GDP-wise, it is 5 trillion, check sector distributions to verify. Likely correct since options CANNOT be ruled out.
- India is Nation B: Sector distribution considerations and GDP should match India's given industry information.
Which of the following information, when considered in addition to the given information, does not allow us to completely identify the nine nations in the graph?
- Germany’s industry GDP is US $1.2 trillion
- The nation ranked fourth in terms of agriculture GDP has its agriculture GDP valued at US $150 billion
- In terms of percentage contribution to the respective nations’ GDP, France and Japan’s agriculture sectors contribute the same
- Japan’s industry GDP is US $1.25 trillion
- Both Japan’s and Germany’s industry GDPs are more than US $1 trillion
The Correct Option is A
Solution and Explanation
Top Questions on Bar Graph
- The number of pens sold by shopkeeper Y in the year 2020 is 25% more than the number of pens sold by him in the year 2019 and the number of pens sold by shopkeeper Z in the year 2019 is 20% less than those sold by him in the year 2020. Find the total number of pens sold by the shopkeepers X and Z in the year 2015.

- Study the following bar-graph carefully and answer the following question. The bar-graph shows the number of pens (in thousand) sold by three shopkeepers X, Y and Z in 5 different years. The total number of pens sold by shopkeeper X in years 2020 and 2022 taken together is what percentage less than the total number of pens sold by shopkeeper Z in years 2021 and 2024 taken together? (correct to two decimal places)
- Over the top (OTT) subscribers of a platform are segregated into three categories: i) Kid, ii) Elder, and iii) Others. Some of the subscribers used one app and the others used multiple apps to access the platform. The figure below shows the percentage of the total number of subscribers in 2023 and 2024 who belong to the 'Kid' and 'Elder' categories.

The following additional facts are known about the numbers of subscribers.
The total number of subscribers increased by 10% from 2023 to 2024.
In 2024, 1/2 of the subscribers from the 'Kid' category and 2/3 of the subscribers from the 'Elder' category subscribers use one app.
In 2023, the number of subscribers from the 'Kid' category who used multiple apps was the same as the number of subscribers from the 'Elder' category who used one app.
10,000 subscribers from the 'Kid' category used one app and 15,000 subscribers from the 'Elder' category used multiple apps in 2023. - An online e-commerce firm receives daily integer product ratings from 1 through 5 given by buyers. The daily average is the average of the ratings given on that day. The cumulative average is the average of all ratings given on or before that day. The rating system began on Day 1, and the cumulative averages were 3 and 3.1 at the end of Day 1 and Day 2, respectively. The distribution of ratings on Day 2 is given in the figure below

The following information is known about ratings on Day 3.
1. 100 buyers gave product ratings on Day 3.
2. The modes of the product ratings were 4 and 5.
3. The numbers of buyers giving each product rating are non-zero multiples of 10.
4. The same number of buyers gave product ratings of 1 and 2, and that number is half the number of buyers who gave a rating of 3. - Six web surfers M, N, O, P, X, and Y each had 30 stars which they distributed among four bloggers A, B, C, and D. The number of stars received by A and B from the six web surfers is shown in the figure below

The following additional facts are known regarding the number of stars received by the bloggers from the surfers.
1. The numbers of stars received by the bloggers from the surfers were all multiples of 5 (including 0).
2. The total numbers of stars received by the bloggers were the same.
3. Each blogger received a different number of stars from M.
4. Two surfers gave all their stars to a single blogger.
5. D received more stars than C from Y
Questions Asked in XAT exam
- An artificial swimming pool is circular and water is flowing clockwise at a speed of 3 km/hr. Two swimmers Ayub and Rana start from diametrically opposite points, Ayub in the anticlockwise direction and Rana in the clockwise direction. They first meet at a point such that Ayub has covered 60 m by that time. Their second meeting point is such that Rana has covered another 180 m after the first meeting point. If the speed of Rana in still water is 3 km/hr, find the time taken by Ayub to cover one full circle in the clockwise direction.
- XAT - 2026
- Time and Work
- Arrange the following generations from the oldest to the youngest:
1. Generation X
2. Silent Generation
3. Generation Alpha
4. Baby Boomers
5. Millennials
- XAT - 2026
- Current Affairs
- Read the following scenario and answer the THREE questions that follow.
Brijbhushan, a microfinancier, lends money at the rate of Rs.10 per square meter to small farmers at a village. He charges an annual interest rate of 10%. All the farming plots in that village are rectangular, with areas varying between a minimum of 1000 square meters and a maximum of 10,000 square meters.
This year, Brijbhushan has lent money only to five farmers: Aditya, Binod, Chhuttan, Dabloo and Govind. The perimeter of Chhuttan’s plot is 250 meters, with the length and width being at a ratio of 4:1. Aditya’s plot has an area three times the area of Govind’s plot. The area of Aditya’s plot is also the average of the areas of Govind’s plot and Dabloo’s plot. The plots belonging to Aditya, Binod and Dabloo are of the same width, but of different lengths. Moreover, the length of Binod’s plot is the sum of the lengths of Aditya’s plot and Dabloo’s plot.- XAT - 2026
- Mensuration
Light Chemicals is an industrial paint supplier with presence in three locations: Mumbai, Hyderabad and Bengaluru. The sunburst chart below shows the distribution of the number of employees of different departments of Light Chemicals. There are four departments: Finance, IT, HR and Sales. The employees are deployed in four ranks: junior, mid, senior and executive. The chart shows four levels: location, department, rank and gender (M: male, F: female). At every level, the number of employees at a location/department/rank/gender are proportional to the corresponding area of the region represented in the chart.
Due to some issues with the software, the data on junior female employees have gone missing. Notice that there are junior female employees in Mumbai HR, Sales and IT departments, Hyderabad HR department, and Bengaluru IT and Finance departments. The corresponding missing numbers are marked u, v, w, x, y and z in the diagram, respectively.
It is also known that:
a) Light Chemicals has a total of 210 junior employees.
b) Light Chemicals has a total of 146 employees in the IT department.
c) Light Chemicals has a total of 777 employees in the Hyderabad office.
d) In the Mumbai office, the number of female employees is 55.

- XAT - 2026
- Pie Charts
An investment company, Win Lose, recruit's employees to trade in the share market. For newcomers, they have a one-year probation period. During this period, the employees are given Rs. 1 lakh per month to invest the way they see fit. They are evaluated at the end of every month, using the following criteria:
1. If the total loss in any span of three consecutive months exceeds Rs. 20,000, their services are terminated at the end of that 3-month period,
2. If the total loss in any span of six consecutive months exceeds Rs. 10,000, their services are terminated at the end of that 6-month period.
Further, at the end of the 12-month probation period, if there are losses on their overall investment, their services are terminated.
Ratan, Shri, Tamal and Upanshu started working for Win Lose in January. Ratan was terminated after 4 months, Shri was terminated after 7 months, Tamal was terminated after 10 months, while Upanshu was not terminated even after 12 months. The table below, partially, lists their monthly profits (in Rs. ‘000’) over the 12-month period, where x, y and z are masked information.
Note:
• A negative profit value indicates a loss.
• The value in any cell is an integer.
Illustration: As Upanshu is continuing after March, that means his total profit during January-March (2z +2z +0) ≥
Rs.20,000. Similarly, as he is continuing after June, his total profit during January − June ≥
Rs.10,000, as well as his total profit during April-June ≥ Rs.10,000.
- XAT - 2026
- Logical and Analytical Reasoning Skills