Question:
Draw the diagram of a sarcomere of skeletal muscle showing different regions.
Draw the diagram of a sarcomere of skeletal muscle showing different regions.
Updated On: Jan 21, 2026
Hide Solution
Verified By Collegedunia
Solution and Explanation
The diagrammatic representation of a sarcomere is as follows:
Was this answer helpful?
1
0
Top Questions on Muscle
- Which of the following is the spurt muscle?
- What are border movement and neutral zone while recording muscles?
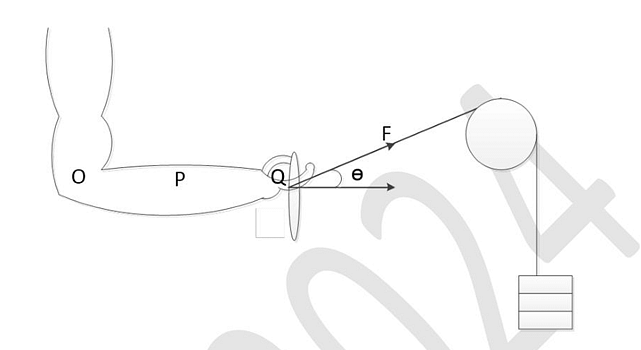
- A person creates an apparatus as shown in the figure to exercise the extensor muscle of the hand. It is given that OP = 0.15 m, OQ = 0.35 m, θ = 30°, the weight of the lower arm = 20 N, the center of mass of the lower arm is at point P, the magnitude of the applied tensile force F = 50 N. If the extensor muscle is acting with a moment arm of 0.25 m, the muscle force required to hold the hand at the position shown in the figure is ______ N. Give your answer rounded off to the nearest integer.
- One of the following is not a part of light band of myofibril.
- Blocks of muscles found in cephalochordata are
View More Questions
Questions Asked in CBSE Class XI exam
- Balance the following redox reactions by ion-electron method:
(a)MnO4- (aq) + I - (aq) → MnO2(s) + I2(s) (in basic medium)
(b) MnO4- (aq) + SO2(g) → Mn2+(aq) +HSO4- (aq) (in acidic solution)
(c) H2O2(aq)+Fe2+(aq) → Fe3+ (aq) + H2O (l) (in acidic solution)
(d) Cr2O72-+ SO2(g) → Cr3+ (aq) +SO42- (aq) (in acidic solution)- CBSE Class XI
- Oxidation Number
- Write the resonance structures for SO3 , NO2 and NO3-
- CBSE Class XI
- Kossel-Lewis Approach to Chemical Bonding
- At 700 K, equilibrium constant for the reaction:
\(H_2 (g) + I_2 (g) ⇋ 2HI (g)\)
is 54.8. If 0.5 mol L–1 of HI(g) is present at equilibrium at 700 K, what are the concentration of H2(g) and I2(g) assuming that we initially started with HI(g) and allowed it to reach equilibrium at 700 K?- CBSE Class XI
- Law Of Chemical Equilibrium And Equilibrium Constant
- Find the mean deviation about the mean for the data 4, 7, 8, 9, 10, 12, 13, 17.
- CBSE Class XI
- Statistics
Find the mean deviation about the mean for the data 38, 70, 48, 40, 42, 55, 63, 46, 54, 44.
- CBSE Class XI
- Statistics
View More Questions