Question:
A planar rectangular paper has two V-shaped pieces attached as shown below.
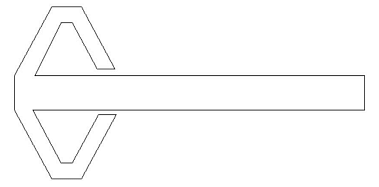
This piece of paper is folded to make the following closed three-dimensional object.
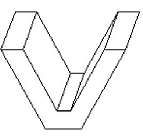
The number of folds required to form the above object is
A planar rectangular paper has two V-shaped pieces attached as shown below.
This piece of paper is folded to make the following closed three-dimensional object.
The number of folds required to form the above object is
This piece of paper is folded to make the following closed three-dimensional object.
The number of folds required to form the above object is
Updated On: Jan 31, 2026
- 9
- 7
- 11
- 8
Hide Solution
Verified By Collegedunia
The Correct Option is A
Solution and Explanation
The correct answer is (A) : 9
Was this answer helpful?
0
0
Top Questions on Data Interpretation
- Select the \textbf{CORRECT option that names the art movements sequentially from left to right.}

- CEED - 2026
- General Aptitude
- Data Interpretation
- The following images show cave paintings from India. Which of the options is correct?

- CEED - 2026
- Observation and design sensitivity
- Data Interpretation
- P is a transparent glass filled with water as shown below. Q is a white cylinder with parallel lines printed around it. If the cylinder is viewed through the glass from the direction of the arrow, find the correct pattern observed.

- CEED - 2026
- Observation and design sensitivity
- Data Interpretation
- A delicious triangular shaped chocolate was left open at night. A mouse could smell the yummy chocolate and could not resist but eat some of it. The remaining chocolate is shown below. How many triangles (including partial) have been eaten?

- CEED - 2026
- Observation and design sensitivity
- Data Interpretation
- The following image shows a set of letters in different fonts. Which of the options is the word formed by letters of the same font?

- UCEED - 2026
- Logical Reasoning
- Data Interpretation
View More Questions
Questions Asked in GATE CE exam
- The President, along with the Council of Ministers, ............. to visit India next week.
- GATE CE - 2025
- Subject Verb Agreement
Consider a five-digit number PQRST that has distinct digits P, Q, R, S, and T, and satisfies the following conditions:
1. \( P<Q \)
2. \( S>P>T \)
3. \( R<T \)
If integers 1 through 5 are used to construct such a number, the value of P is:
- GATE CE - 2025
- Logical and Analytical Reasoning Skills
- Given the following staff readings at two levels, determine the Reduced Level (RL) of B.

Given: - RL of A = 150 m - Find RL of B- GATE CE - 2025
- Surveying and Levelling
- Given the bearing N30°W, determine the corresponding Whole Circle Bearing (WCB). \

Given: - Bearing = N30°W - Find WCB- GATE CE - 2025
- Surveying and Levelling
- Given the following data, determine the final water content \( W_2 \):

Given: - \( W_1 = 18\% \) - \( G_p = 2.74 \) - \( S_1 = 0.65 \) - \( S_2 = 0.852 \) - Find \( W_2 \)- GATE CE - 2025
- Soil Mechanics
View More Questions