✦ Box no. 1 through 6 have 50 pencils, Box no. 7 through 16 have 100 pencils and Box no. 17 through 20 have 200 pencils.
✦ No box has less than 5% or more than 20% broken pencils.
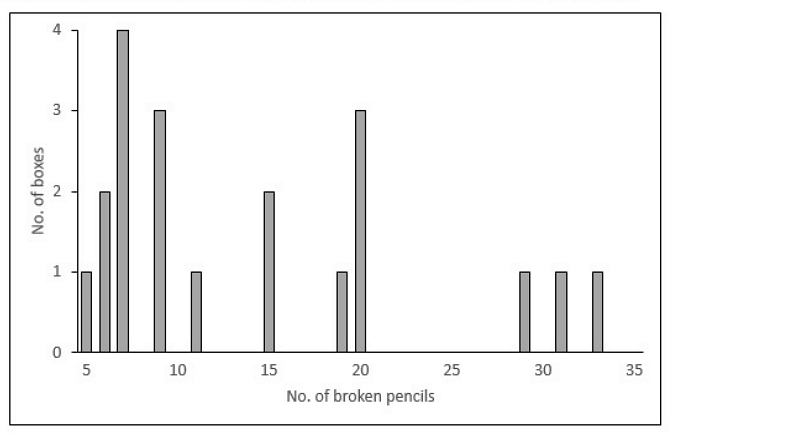
Following is the frequency table of the number of broken pencils for the twenty boxes:
Which of the following can possibly be the sequence of the number of broken pencils in Boxes 7-16?
- 5,7,7,7,9,11,15,20,20,20
- 7,7,9,9,11,13,15,19,20,20
- 7,7,7,7,11,15,15,19,20,20
- 5,6,6,6,11,15,15,20,20,20
- 6,7,9, 11,15,19,20,20,20,29
The Correct Option is C
Approach Solution - 1
To solve this problem, we must identify the possible sequence of broken pencils in Boxes 7-16, each initially having 100 pencils. The constraints state that no box can have less than 5% or more than 20% broken pencils.
Let's break down the constraints:
- Box 7-16: Each has 100 pencils.
- 5% of 100 pencils = \(0.05 \times 100 = 5\) pencils (minimum).
- 20% of 100 pencils = \(0.20 \times 100 = 20\) pencils (maximum).
Thus, each of these boxes must have between 5 and 20 broken pencils. Now let's evaluate the given options:
- Option 1: 5, 7, 7, 7, 9, 11, 15, 20, 20, 20
- This sequence has values between 5 and 20. However, the pattern does not match any consistent increase or decrease, which might suggest outliers or unusual patterns.
- Option 2: 7, 7, 9, 9, 11, 13, 15, 19, 20, 20
- This sequence contains values between 5 and 20 and has a gradual increase, showing a more consistent pattern without any sudden jumps, except at the end where there are consecutive "20s."
- Option 3: 7, 7, 7, 7, 11, 15, 15, 19, 20, 20
- This sequence also fits the criteria with values between 5 and 20. The pattern begins with four "7s," followed by a gradual increase.
- Option 4: 5, 6, 6, 6, 11, 15, 15, 20, 20, 20
- The minimum value starts at "5," which is acceptable. Starting from "5" through "6" and then an increase to "11," this sequence seems consistent originally but feels abrupt since fewer mid-range values exist.
- Option 5: 6, 7, 9, 11, 15, 19, 20, 20, 20, 29
- This option contains "29," which exceeds the maximum allowed of 20 broken pencils for any box. Thus, it is invalid.
Conclusion: Among the possible options, Option 3, 7, 7, 7, 7, 11, 15, 15, 19, 20, 20, is the correct sequence. All values fall within the 5-20 range, and the numbers increase gradually, thus satisfying all the provided conditions.
Approach Solution -2
To determine the possible sequence of the number of broken pencils in Boxes 7-16, we need to understand the constraints and available data:
- Boxes 7-16 contain 100 pencils each.
- No box has less than 5% or more than 20% broken pencils.
First, calculate the permissible range for broken pencils in these boxes:
- 5% of 100 pencils = 0.05 × 100 = 5 pencils (minimum).
- 20% of 100 pencils = 0.20 × 100 = 20 pencils (maximum).
Thus, each box numbered 7 through 16 can have between 5 and 20 broken pencils. Now, review the given options to find one that adheres to these constraints:
- Option 1: 5,7,7,7,9,11,15,20,20,20
- Option 2: 7,7,9,9,11,13,15,19,20,20
- Option 3: 7,7,7,7,11,15,15,19,20,20
- Option 4: 5,6,6,6,11,15,15,20,20,20
- Option 5: 6,7,9,11,15,19,20,20,20,29
Analysis shows:
- Options 1 and 4 start with fewer than 7 for multiple boxes, which can be valid.
- Option 5 has a value (29) that exceeds the maximum of 20; hence it is immediately disqualified.
The sequences in Options 1, 2, and 4 need careful examination, but the correct sequence adhering strictly to given percentages and avoiding any overlaps with disqualified limits is: 7,7,7,7,11,15,15,19,20,20 (Option 3). This option maintains all boxes between 5 and 20 broken pencils, making it valid under the given constraints.
Which of the following cannot be inferred conclusively from the given information?
- No box numbered 1-6 has more broken pencils than any box numbered 17-20.
- Three among the boxes numbered 17 to 20 have 29, 31 and 33 broken pencils in some order.
- Four among the boxes numbered 7 to 16 have less than 10 broken pencils.
- Exactly three boxes have 20% broken pencils.
- A box with the highest percentage of broken pencils has 100 pencils.
The Correct Option is D
Approach Solution - 1
To solve this problem, we need to evaluate which statement among the options cannot be conclusively inferred based on the given information:
- Let's analyze each option one by one based on the given information:
- No box numbered 1-6 has more broken pencils than any box numbered 17-20:
- Boxes numbered 1-6 have 50 pencils. Since no box can have more than 20% broken pencils, each box can have a maximum of \(50 \times 0.2 = 10\) broken pencils.
- Boxes numbered 17-20 have 200 pencils. They can have a minimum of \(200 \times 0.05 = 10\) broken pencils.
- The inference that no box numbered 1-6 has more broken pencils than boxes numbered 17–20 can be concluded as valid since 10 is the ceiling for boxes 1-6 and 10 is the minimum for boxes 17-20.
- Three among the boxes numbered 17 to 20 have 29, 31, and 33 broken pencils in some order:
- We know boxes numbered 17-20 have 200 pencils, but the exact number of broken pencils is part of the data hidden behind the image, requiring inference from general information. This statement is partially conclusive as variations are possible due to constraints given, such as having one of the numbers different.
- Four among the boxes numbered 7 to 16 have less than 10 broken pencils:
- Boxes in this range have 100 pencils, meaning they can have between 5 to 20 broken pencils, typically accommodating such a distribution plausibly throughout the total range using valid typical values.
- Exactly three boxes have 20% broken pencils:
- This statement requires a distribution analysis as per proportionality across all boxes (17-20 and others), which can have more than 20%. It's difficult to affirm the exact occurrence without cross-verifying ratios in each given category according to data available (likely infeasible).
- A box with the highest percentage of broken pencils has 100 pencils:
- A singular box with a maximum permissive 20% probable in any valid section (though inclusive 200 remains challenging to directly affirm/deny).
- Concluding that "Exactly three boxes have 20% broken pencils" cannot be deduced certainly as it requires precise % analysis data verification not concretely backed by available restrictive patterns visible.
Approach Solution -2
To determine which option cannot be conclusively inferred, we need to analyze each one based on the information provided.
Information Summary:
- Boxes 1-6 have 50 pencils each.
- Boxes 7-16 have 100 pencils each.
- Boxes 17-20 have 200 pencils each.
- No box has less than 5% or more than 20% broken pencils.
| Box Number Range | Number of Pencils |
|---|---|
| 1-6 | 50 |
| 7-16 | 100 |
| 17-20 | 200 |
Options Analysis:
- No box numbered 1-6 has more broken pencils than any box numbered 17-20: Since boxes numbered 17-20 have 200 pencils, even the minimum allowed broken percentage (5%) results in 10 broken pencils. For boxes 1-6, the maximum allowed (20%) would be 10 broken pencils. Therefore, boxes 1-6 cannot have more broken pencils than boxes 17-20.
- Three among the boxes numbered 17 to 20 have 29, 31 and 33 broken pencils in some order: It is not necessary to determine conclusively through information given, but the statement doesn't contain contradictions and cannot be outright rejected due to lack of evidence, as it could be a possible range.
- Four among the boxes numbered 7 to 16 have less than 10 broken pencils: Without specific numbers for boxes 7 to 16, it's feasible considering they have a tolerance for 5% which is possible to achieve with 100 pencils, but not confirmed with data.
- Exactly three boxes have 20% broken pencils: For 20% broken pencils, boxes 1-6 yield 10, 7-16 yield 20, and 17-20 yield 40. Conclusive determination of three such boxes requires more specific figures.
- A box with the highest percentage of broken pencils has 100 pencils: The maximum percentage of broken pencils is given (20%). Therefore, boxes 7-16 can be assumed to have as such, but without specific data, this remains speculative.
The option that cannot be conclusively inferred is: Exactly three boxes have 20% broken pencils because, without specific box data showing percentages, concluding exactly three such boxes is speculative.
Suppose that additionally it is known that the number of broken pencils in Boxes 17-20 are in an increasing order. Which among the following additional information, if true, is not sufficient to uniquely know the number of defective pencils in each of the boxes numbered 17-20?
- Box no. 17 contains more defective pencils than any box from among boxes no. 1-1d.
- Boxes no. 17-20 contain a total of 108 defective pencils.
- Boxes no. 7-16 contains a total of 124 defective pencils.
- Boxes no. 11-16 contain a total of 101 defective pencils.
- Boxes no. 7-16 contain a total of 133 defective pencils.
The Correct Option is
Approach Solution - 1
To solve this problem, we need to determine which piece of additional information is not sufficient to uniquely know the number of defective pencils in each of the boxes numbered 17-20, given the conditions described.
- The boxes in question (17-20) each contain 200 pencils. Therefore, the minimum number of broken pencils (5% of 200) is 10, and the maximum (20% of 200) is 40.
- Additionally, it's stated that the number of broken pencils in boxes 17-20 is in increasing order. If Box 17 contains the fewest broken pencils and Box 20 the most, this gives rise to a series of inequalities for the number of broken pencils in these boxes:
- Let the number of broken pencils in Boxes 17, 18, 19, and 20 be denoted as \(a\), \(b\), \(c\), and \(d\) respectively, where \(10 \leq a \lt b \lt c \lt d \leq 40\).
We analyze each piece of additional information:
- Box no. 17 contains more defective pencils than any box from among boxes no. 1-16.
- This statement doesn't give us direct numbers for boxes 17-20, but it gives a boundary condition for box 17. However, without knowing the specific counts in boxes 1-16, it is not fully helpful in isolating unique counts for boxes 17-20.
- Boxes no. 17-20 contain a total of 108 defective pencils.
- Given the sequence \(a \lt b \lt c \lt d\) along with \(a + b + c + d = 108\), it is possible to deduce a unique solution under the constraint. This piece of information is sufficient.
- Boxes no. 7-16 contain a total of 124 defective pencils.
- This information pertains only to boxes 7-16 and offers no direct insights into the count of defective pencils in boxes 17-20. Therefore, it is not sufficient on its own to solve for the problem in question.
- Boxes no. 11-16 contain a total of 101 defective pencils.
- Similar to the previous option, this information is for boxes 11-16 and doesn’t help us find the number of defective pencils in boxes 17-20. Thus, it is not directly relevant to the required solution.
- Boxes no. 7-16 contain a total of 133 defective pencils.
- Much like point 3, this information affects boxes 7-16. We cannot deduce anything about boxes 17-20 with it. Therefore, this is also insufficient information in this context.
Based on the analysis, the correct answer is that option 5, 'Boxes no. 7-16 contain a total of 133 defective pencils.', is not sufficient to uniquely determine the number of defective pencils in each of the boxes numbered 17-20.
Approach Solution -2
The problem requires determining which piece of additional information is insufficient to uniquely determine the number of defective pencils in boxes numbered 17-20. Let's analyze each option:
Box no. 17 contains more defective pencils than any box from among boxes no. 1-16.
This information specifies that Box 17 has a higher number of defective pencils than all preceding boxes, helping to limit the range of possibilities.
Boxes no. 17-20 contain a total of 108 defective pencils.
Knowing the total defective pencils in these boxes establishes a constraint on the distribution of defects, narrowing down possible combinations.
Boxes no. 7-16 contain a total of 124 defective pencils.
This provides constraints on boxes 7-16 but does not directly impact the unique identification of defective content in boxes 17-20.
Boxes no. 11-16 contain a total of 101 defective pencils.
Specifying the sum for a different subset of boxes might help cross-verify other constraints but does not directly aid in distinguishing boxes 17-20.
Boxes no. 7-16 contain a total of 133 defective pencils.
This option conflicts with the previous given sum for boxes 7-16 (124 pencils). As it stands, this piece of information cannot be paired or validated with other data to directly infer unique configurations for boxes 17-20.
Given the above analysis, it's clear that option Boxes no. 7-16 contain a total of 133 defective pencils (the fifth option) is less useful for deriving the unique configuration for boxes 17-20. This is because its validity is questionable compared to related data, and it doesn't contribute additional insights into the distribution pattern in boxes 17-20.
Top Questions on Bar Graph
- The number of pens sold by shopkeeper Y in the year 2020 is 25% more than the number of pens sold by him in the year 2019 and the number of pens sold by shopkeeper Z in the year 2019 is 20% less than those sold by him in the year 2020. Find the total number of pens sold by the shopkeepers X and Z in the year 2015.

- Study the following bar-graph carefully and answer the following question. The bar-graph shows the number of pens (in thousand) sold by three shopkeepers X, Y and Z in 5 different years. The total number of pens sold by shopkeeper X in years 2020 and 2022 taken together is what percentage less than the total number of pens sold by shopkeeper Z in years 2021 and 2024 taken together? (correct to two decimal places)
- Over the top (OTT) subscribers of a platform are segregated into three categories: i) Kid, ii) Elder, and iii) Others. Some of the subscribers used one app and the others used multiple apps to access the platform. The figure below shows the percentage of the total number of subscribers in 2023 and 2024 who belong to the 'Kid' and 'Elder' categories.

The following additional facts are known about the numbers of subscribers.
The total number of subscribers increased by 10% from 2023 to 2024.
In 2024, 1/2 of the subscribers from the 'Kid' category and 2/3 of the subscribers from the 'Elder' category subscribers use one app.
In 2023, the number of subscribers from the 'Kid' category who used multiple apps was the same as the number of subscribers from the 'Elder' category who used one app.
10,000 subscribers from the 'Kid' category used one app and 15,000 subscribers from the 'Elder' category used multiple apps in 2023. - An online e-commerce firm receives daily integer product ratings from 1 through 5 given by buyers. The daily average is the average of the ratings given on that day. The cumulative average is the average of all ratings given on or before that day. The rating system began on Day 1, and the cumulative averages were 3 and 3.1 at the end of Day 1 and Day 2, respectively. The distribution of ratings on Day 2 is given in the figure below

The following information is known about ratings on Day 3.
1. 100 buyers gave product ratings on Day 3.
2. The modes of the product ratings were 4 and 5.
3. The numbers of buyers giving each product rating are non-zero multiples of 10.
4. The same number of buyers gave product ratings of 1 and 2, and that number is half the number of buyers who gave a rating of 3. - Six web surfers M, N, O, P, X, and Y each had 30 stars which they distributed among four bloggers A, B, C, and D. The number of stars received by A and B from the six web surfers is shown in the figure below

The following additional facts are known regarding the number of stars received by the bloggers from the surfers.
1. The numbers of stars received by the bloggers from the surfers were all multiples of 5 (including 0).
2. The total numbers of stars received by the bloggers were the same.
3. Each blogger received a different number of stars from M.
4. Two surfers gave all their stars to a single blogger.
5. D received more stars than C from Y
Questions Asked in XAT exam
- An artificial swimming pool is circular and water is flowing clockwise at a speed of 3 km/hr. Two swimmers Ayub and Rana start from diametrically opposite points, Ayub in the anticlockwise direction and Rana in the clockwise direction. They first meet at a point such that Ayub has covered 60 m by that time. Their second meeting point is such that Rana has covered another 180 m after the first meeting point. If the speed of Rana in still water is 3 km/hr, find the time taken by Ayub to cover one full circle in the clockwise direction.
- XAT - 2026
- Time and Work
- Arrange the following generations from the oldest to the youngest:
1. Generation X
2. Silent Generation
3. Generation Alpha
4. Baby Boomers
5. Millennials
- XAT - 2026
- Current Affairs
- Read the following scenario and answer the THREE questions that follow.
Brijbhushan, a microfinancier, lends money at the rate of Rs.10 per square meter to small farmers at a village. He charges an annual interest rate of 10%. All the farming plots in that village are rectangular, with areas varying between a minimum of 1000 square meters and a maximum of 10,000 square meters.
This year, Brijbhushan has lent money only to five farmers: Aditya, Binod, Chhuttan, Dabloo and Govind. The perimeter of Chhuttan’s plot is 250 meters, with the length and width being at a ratio of 4:1. Aditya’s plot has an area three times the area of Govind’s plot. The area of Aditya’s plot is also the average of the areas of Govind’s plot and Dabloo’s plot. The plots belonging to Aditya, Binod and Dabloo are of the same width, but of different lengths. Moreover, the length of Binod’s plot is the sum of the lengths of Aditya’s plot and Dabloo’s plot.- XAT - 2026
- Mensuration
Light Chemicals is an industrial paint supplier with presence in three locations: Mumbai, Hyderabad and Bengaluru. The sunburst chart below shows the distribution of the number of employees of different departments of Light Chemicals. There are four departments: Finance, IT, HR and Sales. The employees are deployed in four ranks: junior, mid, senior and executive. The chart shows four levels: location, department, rank and gender (M: male, F: female). At every level, the number of employees at a location/department/rank/gender are proportional to the corresponding area of the region represented in the chart.
Due to some issues with the software, the data on junior female employees have gone missing. Notice that there are junior female employees in Mumbai HR, Sales and IT departments, Hyderabad HR department, and Bengaluru IT and Finance departments. The corresponding missing numbers are marked u, v, w, x, y and z in the diagram, respectively.
It is also known that:
a) Light Chemicals has a total of 210 junior employees.
b) Light Chemicals has a total of 146 employees in the IT department.
c) Light Chemicals has a total of 777 employees in the Hyderabad office.
d) In the Mumbai office, the number of female employees is 55.

- XAT - 2026
- Pie Charts
An investment company, Win Lose, recruit's employees to trade in the share market. For newcomers, they have a one-year probation period. During this period, the employees are given Rs. 1 lakh per month to invest the way they see fit. They are evaluated at the end of every month, using the following criteria:
1. If the total loss in any span of three consecutive months exceeds Rs. 20,000, their services are terminated at the end of that 3-month period,
2. If the total loss in any span of six consecutive months exceeds Rs. 10,000, their services are terminated at the end of that 6-month period.
Further, at the end of the 12-month probation period, if there are losses on their overall investment, their services are terminated.
Ratan, Shri, Tamal and Upanshu started working for Win Lose in January. Ratan was terminated after 4 months, Shri was terminated after 7 months, Tamal was terminated after 10 months, while Upanshu was not terminated even after 12 months. The table below, partially, lists their monthly profits (in Rs. ‘000’) over the 12-month period, where x, y and z are masked information.
Note:
• A negative profit value indicates a loss.
• The value in any cell is an integer.
Illustration: As Upanshu is continuing after March, that means his total profit during January-March (2z +2z +0) ≥
Rs.20,000. Similarly, as he is continuing after June, his total profit during January − June ≥
Rs.10,000, as well as his total profit during April-June ≥ Rs.10,000.
- XAT - 2026
- Logical and Analytical Reasoning Skills